Charting a mathematical equation using Excel and defined names
Pages in this article
Introduction
When doing mathematics, wouldn't it be nice if we could type an equation into a cell in Excel and immediately see the resulting graph?
Suppose we have an equation like:
y=x2-2.x+6
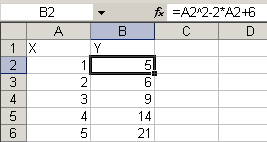
Normally, we would create a column with x values and in the adjacent column "translate" this formula into a cell formula:
=A2^2-2*A2+6
and copy this formula down to match the number of x values in column A:

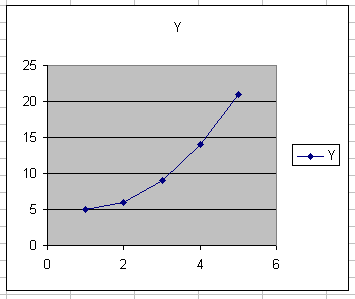
Subsequently, we would base a chart on this set of data:

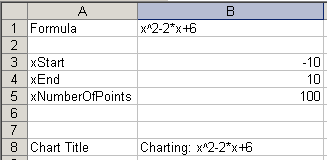
This method lacks flexibility. It would be much more convenient, if we could:
- Enter the (any!) formula into a single cell
- Enter the lower and upper limit of the x-range into two other cells
- Enter the number of values to use for the chart in yet another cell:

Yet another constraint we're going to place on this task:
Apart from the cells shown in the figure above, no cells are to be used, just defined names with formulas.

